Intraday Trading in Flat Markets: Indicators That Still Deliver Returns in 2025
Intraday trading especially of Nifty 50 index requires precision, discipline and a comprehensive understanding of the market. Quieter markets when markets become rangebound and choppy and lack direction create a different set of challenges for traders looking to trade intraday. In these conditions, having strong technical indicators at your fingertips is the difference between getting a return and having failed trades. This article discusses five robust signals that still work for a nifty intraday trading algorithm 2025 even in direction less markets.. Every indicator is chosen to deliver insightful information so you get through flat markets with ease. Whether you’re new to the game or a seasoned vet, such tools, used with discipline, can bolster your decision-making and improve your results.

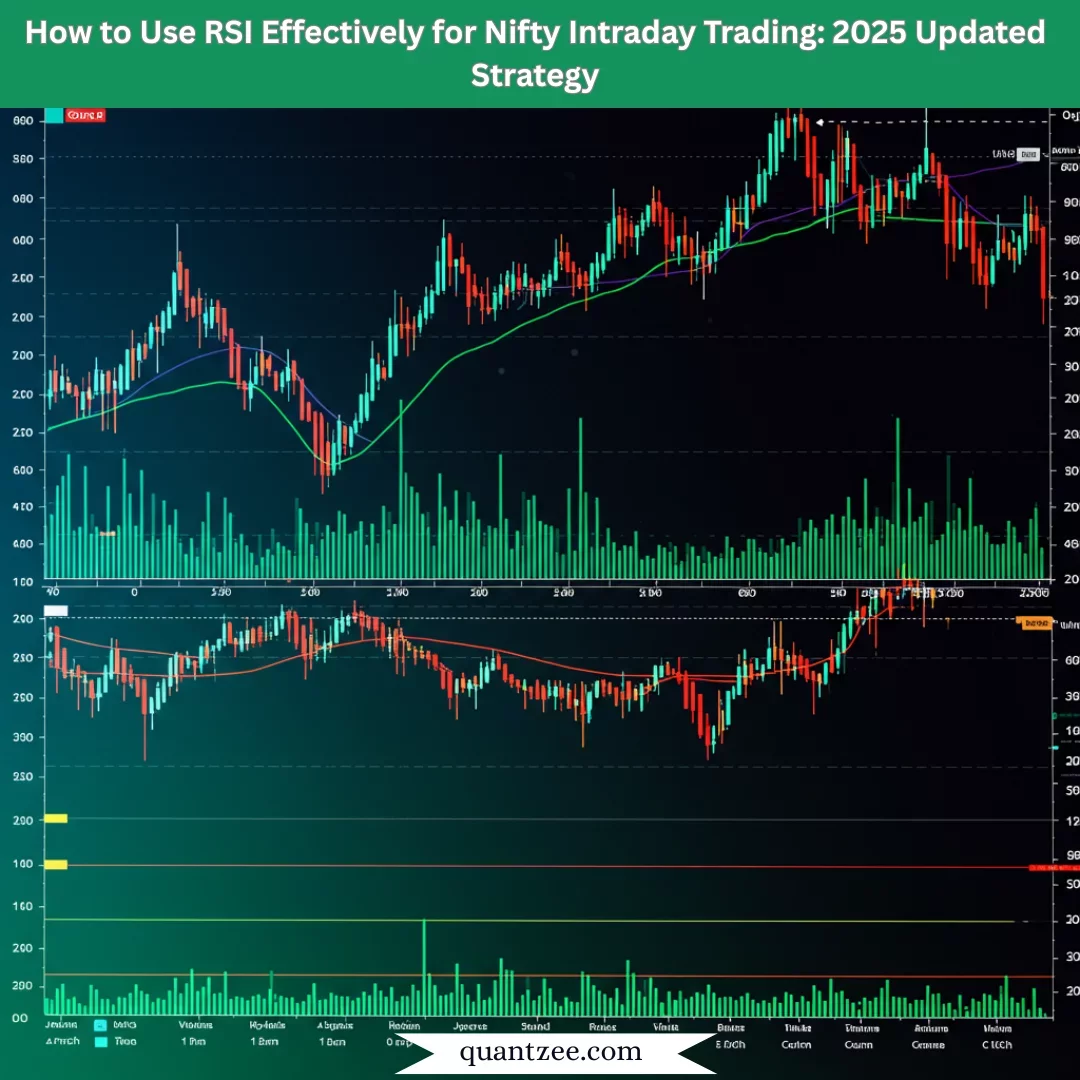
1. Relative Strength Index (RSI) for Identifying Overbought and Oversold Conditions
RSI (Relative Strength Index) RSI is a momentum oscillator that measures the speed and change of price movements, providing valuable insight to traders for intraday trading of flat markets. In consolidating periods, RSI helps traders spot an overbought (above 70) and oversold (below 30) market conditions in the day trading days.
Applied How To: With RSI indicator for Nifty intraday trading, the recommended setting is a 14 period look-back on a 5 or 15 minute chart. RSI readings around 30 or 70 can be used to anticipate reversals. For instance, if in case the Nifty is giving an RSI below 30 then it might give indication of possible bounce on the upside, so it is a buy signal.
Why It Works in Flat Markets: When you see flat markets, a market that is going back and forth within a certain range just as prices are moving too far in either direction, RSI gives very clear signals of when it is entering and exiting the market.
Tip: You can use RSI in conjunction with support and resistance levels to validate the trading signals and avoid false positives. Products such as Trading View can offer smart RSI-based indicators provided by Quantzee to help retail traders analyze the market with more ease.
When they are used strategically, traders can time their trades well, and benefit from short term market swings, even when the markets are low volatile.
2. Bollinger Bands for Capturing Range-Bound Price Movements
Bollinger Bands is a volatility indicator based on a SMA that is surrounded by two SD bands. During sideways markets the bands tend to contract which indicates lower volatility and offers potential entry points for traders who wish to benefit from ranges, i.e. price oscillations.
Application: For aNifty intraday trading system, use a 15 minutes chart, with Bollinger Bands and an SMA (Simple Moving Average) of 20 adapted on two standard deviations. Buy on touch of lower band and downward reversal and sell on touch of upper band.
Why It Works in Flat Markets: In a flat market, Bollinger Bands squeeze, revealing tight ranges, which, in turn, makes them more prone to breakout or reversal setups. This is very handy for Nifty Traders which are interested to do scalping in small price movements.
Tip: Use Bollinger Bands in conjunction with volume analysis to validate price reversals. If you also can see a high volume at the lower band then that makes a good case to go for buy signal.
The dynamic nature of this indicator is one of the reason why it is so powerful for intraday traders that want consistent returns in range bound markets.
-r5nxgvotg7.webp)
3. Moving Average Convergence Divergence (MACD) for Trend Confirmation
MACD The versatile signal that checks momentum and trend direction is used even in no trend market. The MACD is calculated by subtracting the 26 day EMA from the 12 day EMA, and then a 9 day EMA of the MACD is plotted to signal potential buy or sell opportunities.
Application: For Nifty intraday trading, you can setup MACD indicator as standard ( 12, 26, 9 ) settings in a 5 minute chart. A bullish crossover (the MACD line crosses above the signal line) is considered a buy signal, and a bearish crossover is considered a sell signal.
Why It Stands Out in Flat Markets: During a period in which the market is range-bound, MACD helps identify small changes in the range, so traders can use it to take advantage of minor price fluctuations. Its signals are crossed from the signal line so you know that the entry and exit is clear.
Tip: Do not trade MACD signals during periods of low volatility because it is likely to result in false signals. Apply technology based indicator Quantzeeto eliminate noise and get more accurate moving average convergence divergence for Nifty trading.
By boiling the market’s momentum down to its essence, the MACD makes it easy for coffee. FORCE traders to react when the market has no real trend in play.
4. Volume Weighted Average Price (VWAP) for Benchmarking Price Levels
The VWAP coin (volume weighted average price) is an essential day trading indicator, representing the average price for the day weighted by trading volume. VWAP acts as a fair price that traders who are active and regularly trading Nifty use, it also acts as a value zone indicating whether the buyers or sellers got a good deal.
Application: In 5 min Nifty chart use VWAP to check if Nifty price is trading above (bullish) or below (bearish) average price. Similarly, puchases and sales around the VWAP can be used to trade with short term momentum.
Why the VWAP Works in Flat Markets: If used properly, the VWAP will help your trading in a flat market by anchoring the trades to the average price of the day, which can keep you from overpaying or underselling in a range-bound market.
Tip: To validate trade entries, use VWAP together with support and resistance levels. Price action near VWAP on high volume may be a sign of more conviction.
VWAP, with its emphasis on volume-weighted pricing, is one of the primary tools traders use to make intraday decisions.
5. Stochastic Oscillator for Precision Timing
The Stochastic Oscillator is a momentum indicator that is designed to compare a security’s closing price to the high/low price range over a certain period. It performs very well in flat markets since it accurately position to overbought and oversold, even better than RSI, that's perfect tool for timing entry and exit.
Application: Apply Stochastic Oscillator (14, 3, 3) on 15 minute chart for Nifty intraday trading. Wait for overbought or oversold crossovers to suggest potential reversals. For example, a crossover under selling vaccines could constitute a buying opportunity.
Why It Works in Flat Markets: Stochastic Oscillator’s sensitivity to extremes in price, traders can pinpoint short-term reversals within a range, increasing returns in consolidating markets.
Tip: Combine the Stochastic Oscillator with candlestick patterns, for example doji or hammer, to verify a reversal signal and increase trade accuracy.
This is a very accurate indicator makes ist very beneficial for adding to your Nifty Intraday Trading system though very much useful in sideways markets.
Conclusion
Trading flat markets can be frustrating without some structure and the tools to leap on to short-term opportunities in the limited range trading conditions. The five such indicators mentioned here RSI, Bollinger Bands, MACD, VWAP, Stochastic Oscillator are a handy guide which a trader can use to develop a successful nifty intraday trading algorithm in 2025. Using these, traders are able to make educated decisions, take advantage of short-term price waves, and mitigate risks efficiently. To help improve your trading experience you might want to try an innovative platform like TradingViewwhich offers intelligent algorithms from Quantzee which streamline your analysis and help you identify which assets to trade. Begin including these signals in your daily trading routine, try them out on a demo account and finetune the methodology till you are able to produce consistent returns in the most challenging market circumstances.
GET IN TOUCH
Mail us at: [email protected]
Find detailed information about this at: https://quantzee.com/
Stay connected with us! Follow us on our social media channels for the latest information & updates.
Sign up for our newsletter
Subscribe to receive daily sparks of creativity, insights, and growth tips